All posts by year
2024
Hindsight is 20/20
22 Nov 2024
Some (as always, strictly personal) thoughts regarding Northvolt’s recently announced Chapter 11 filing. Amongst all the confident hot takes out there speculating what went wrong I think it’s worth taking a brief step back.
While at UU I, and others in the group, had the opportunity to visit Northvolt in 2017 when they were still around 60 employees. A key part of their thesis was that their plan to make ‘good enough’ (my words) NMC batteries would suffice because it was understood there would be plenty of demand - a refreshing perspective at a time when the field was obsessed with next-generation chemistries. They brought with them a lot of experience from Tesla and Asian battery manufacturers and a strong rationale for building the factory in Skellefteå. I bought it - and I don’t remember anyone disagreeing that it was exactly the sort of initiative the EU needed to move away from complete dependence on Asian suppliers, as evidenced by the amount of investment they attracted.
If you look at projections of battery demand and production from that time, you’d see projections of global battery demand around 200 GWh by now. 7 years later, the reality is closer to 1 TWh, with global production being almost 3 times that, dominated by China. To add to that, practically nobody outside of China foresaw the emergence of cell-to-pack and re-emergence of LFP in 2020 which has thrown the future and wisdom of NMC chemistry into doubt in recent years. Everybody knew about the competition from China, and still Chinese companies took everyone by surprise. Batteries are hard, but not impossibly complicated, the likes of CATL, BYD etc are proving that. What is perhaps harder is replicating a relatively mature industry when the incumbents are still well on the front foot.
Northvolt's attitude to safety concerns me
18 Aug 2024
Swedish media are reporting (here and here) that Northvolt encouraged employees at their Skellefteå plant to continue to work in areas affected by a leak of ammonia, well in excess of legal exposure limits, on the basis that they had PPE which could tolerate the higher levels. I haven’t seen much reporting in English on this, but if the reporting is even remotely correct then this is concerning.
Briefly:
-
Ammonia levels up to 155 ppm were measured, and the maximum exposure limit set by the Swedish Work Environment Authority is 50 ppm
-
The company reportedly encouraged workers to continue working in affected environments with personal protective equipment (PPE) and an internally-determined exposure limit of 500 ppm, on the basis that the PPE could handle this level
-
Northvolt argues that safety is its top priority, that it is following the Work Environment Authority’s guidelines and implies that the media is encouraging workers to be concerned
My strictly personal thoughts:
-
The 50 ppm level reported is the korttidsgränsvärde (short-term limit), which for the special case of ammonia applies to 5 minutes of exposure (normally, it is 15 minutes). For an 8 hour day, the legal limit is, in fact, 20 ppm (source).
-
The US EPA sets the Acute Exposure Guideline level 2 (AEGL-2) limit for ammonia at 160 ppm for a 60 minute exposure, and 110 ppm for a 4 hour exposure. This is the level above which a person would be expected to be at risk of irreversible health effects and/or an impaired ability to escape - if exposed a single time in their entire life. Northvolt indicate the maximum level they measured was 155 ppm.
-
The US NIOSH sets the immediate danger to life and health (IDLH) level at 300 ppm. The AEGL-3 for an 8 hour duration (life-threatening level) is 390 ppm. Both are substantially below Northvolt’s ‘internal limit’
-
The reporting suggests that workers were encouraged to work as normal, with PPE, despite the elevated levels. If true, this bothers me. PPE is the last resort after all other possible risk mitigations. Adopting PPE in this situation would be acceptable if the work was to fix the leak and reduce the ammonia levels. Otherwise, established practice would be to stop work until the root cause is solved and levels brought well below the legal limits
-
Even allowing work to continue with PPE under these conditions carries substantial risk. It assumes the PPE is used correctly, fits correctly, is in good condition, that the workers can use it correctly - at levels which mean serious harm if these assumptions are not correct
-
Ammonia is corrosive and damages the nerves in the nose (and the lungs), causing people to become less sensitive to its smell over time
Northvolt’s responses to these reports don’t reassure me. My impression is that production comes first, not safety, and I’m not sure using PPE as a workaround while there is a corrosive gas leak in the building is even compliant with legal requirements let alone best practice. I recognise that the company receives a lot of media attention, and could argue the attention is disproportionate, but Northvolt is in the news increasingly for all the wrong reasons. A cursory look at Swedish social media shows that their public image is taking a beating right now. I want to see them succeed, but their approach to safety, public relations, and working conditions has to match the lofty ambitions and vision they have for industrial transformation.
2023
Battery metrics - the gap between theory and practice
31 Jan 2023
Have you read the new perspective article by me, James Frith and Ulderico Ulissi yet?
Just one of the many topics we discuss is the gap between theory and practice in terms of metrics such as energy density, which I’ll briefly elaborate on here.
Specific energy (Wh/kg) and energy density (Wh/L) are two very important metrics for batteries (though far from the only important ones), as they describe the weight or volume required to store a given energy. Batteries are, if we’re honest, not that good at this.
2022
Reinventing the DCIR wheel
05 Dec 2022
There is a new paper out comparing AC & DC methods for resistance determination in batteries which frustrates me, for several reasons. Some of these reasons are purely self-centred but others I think reflect many problems with publishing today.
Commentary on the teardown of the Tesla 4680 cell at The Limiting Factor
18 Jul 2022
So I had been meaning for a while to do a little commentary on the Tesla 4680 teardown organised by The Limiting Factor, partly because teardown is part of my day job… so here come some observations, starting with the “part 1” video:
4:27 - Cell voltage is pretty low, 0.14 V - which is way below the usual 0% SoC. The cell is dented, but the voltage is not zero, so tells me it’s not short circuited (at least at the time of teardown) - guessing it was discarded from the line and hasn’t gone through formation
Are Prussian Blue analogue (PBA)-based Na-ion batteries safe?
26 Jun 2022
Are Prussian Blue analogue (PBA)-based Na-ion batteries safe? Safer than LFP? It’s been argued to me a number of times that no oxygen in the cathode means no thermal runaway, but is that true? I think the evidence suggests no, and the hazards may actually be quite significant:
Looking for feedback from my followers on the future of this website
06 Jun 2022
Looking for some feedback from my followers regarding the future of my website, in particular the electrochemistry & battery chem tutorials..
What started out as a barely-visited personal website while a postdoc has become seemingly a quite popular resource for knowledge on niche academic topics (particularly impedance spectroscopy), with consistently ~3000 visitors/month for several years now. I’m very happy, and flattered, that so many have found it useful in spite of the fact that I never really attempted to market it, or even develop it much in the last 6 years or so.
Two more excellent papers
22 Mar 2022
Two more excellent Li-S battery papers from @yuchuan_chien published in as many days!
Response to Tim Holme
09 Feb 2022
Many thanks and credit to @ironmantimholme for taking the time to reply and give us all a bit more insight into QuantumScape’s thinking! I do also agree with a lot of it and appreciate the value of proving capability at single layer - if it doesn’t work there it’ll never work.
I would also agree that Li plating is likely a major failure mode for the 2170 cell. In Sweden we have had a close academic-industrial collaboration on degradation in commercial cells - the last phase being the so-called “fast-charging project” where my colleagues looked at the degradation of cells charged at rates up to 4C, finding Li plating was significant from 3C and associated gas evolution at 4C giving a large impedance rise that led to similarly rapid cap. loss. This was published a few years ago (open access).
On QuantumScape's cell performance
07 Feb 2022
Probably should go without saying that criticism from a competitor should be taken with a pinch of salt. But still, not for the first (or last) time @QuantumScapeCo spark debate with a showcase of their technology with only small-scale cells…
Now I’ve found these showcases very interesting so far, but I think the big problem is that they are presentations which would feel more at home at a battery conference, rather than the main vehicle for a public company communicating their progress to the public. And at the core of this debate are questions about what properties or performance attainable at single-layer credit card-size cell size (~0.1-0.2 Ah) can be scaled to automotive (»10 Ah). And this is an important Q for applied research where the answer isn’t always obvious.
Estimating the energy density of BYD Blade battery cells
07 Jan 2022
There’s an interesting discussion in this nice new video from @LimitingThe on an apparent gap between BYD’s reported Wh/L for the Blade pack and what it likely is. There’s probably some lessons here about not trusting everything you find on the internet…
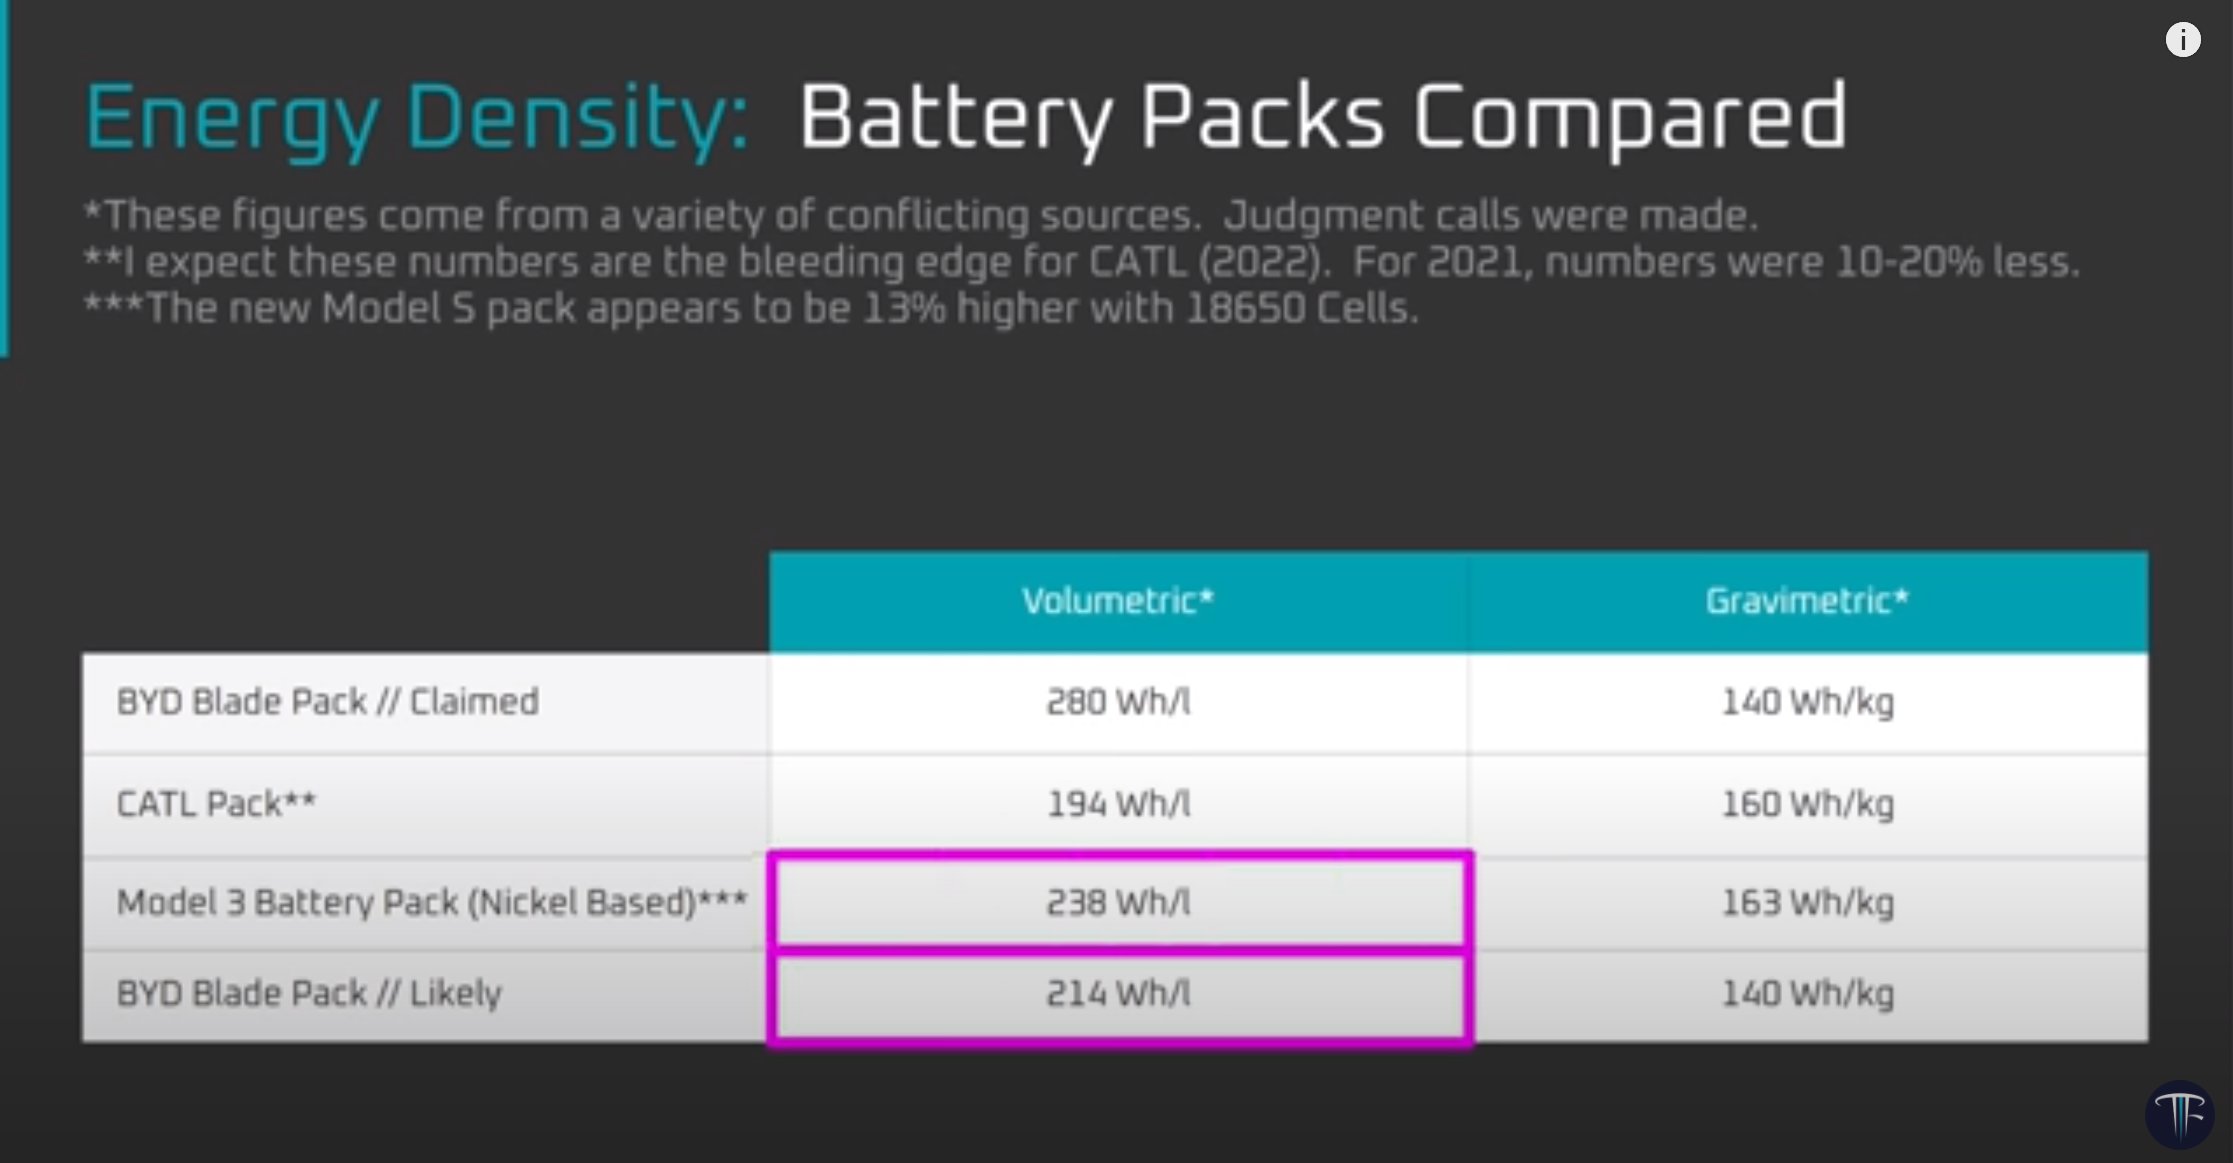
First, an admission… I have seen some measurement data which I’m not at liberty to disclose, but I’ve had a number of conversations in which the Blade energy density has come up, resulting in surprise when I mention it has very likely been overstated online. As @LimitingThe points out, in the absence of hard evidence we are just speculating. But we can take a closer look at the numbers in context and see if they make sense in the grand scheme of things.
Our Next Energy
06 Jan 2022
Was interested yesterday to see this announced demonstration of a Tesla Model S fitted with a prototype battery with 416 Wh/L on pack level. It’s a clear demonstration that range anxiety need not be a thing, but it raises a lot of questions which got me thinking a bit…
2021
LFP-Si vs LFP-Li, in principle
10 Sep 2021
On @stevelevine’s request, I have taken a look at how LFP/Si stacks up against ‘anode-free’ LFP/Li energy density-wise, following recent announcements…
Result: 100% Si looks potentially pretty close to Li, maybe better on Wh/L if paired with NMC811. With some caveats…
Some considerations about fast charging, and Storedot
01 Sep 2021
I can think of one commercial battery with faster charging, Toshiba SCiB: 26 Ah cell w/ 0-80% in 6 minutes, thanks to the LTO anode (with drawback of lower energy density). Storedot approach is interesting but I imagine comes with some challenges…
That overhyped Na-Cl2 battery
30 Aug 2021
News: new battery could mean six times the range in an electric car! 🙌
Press release: six times the electrode capacity compared to lithium-ion batteries 👍
Paper (in Nature): …normalised to the mass of a carbon coating on a Ni foam electrode 🤔
Guesstimating power and energy tradeoffs
26 Aug 2021
This question on what areal capacity (mAh/cm²) is ok for batteries and power/energy tradeoffs is quite important. But it’s something we can quickly look at with the help of my cell modelling tool 😉 (with some mods)
Lyten
22 Aug 2021
Trying to dig a little into Lyten as a new Li-S company on the scene piqued my interest. But so far difficult to find much information. Core business seems to be graphene & carbon materials, with ‘the first coin cell’ made relatively recently in 2017…
Modelling LFP-Li cells
18 Aug 2021
So, @DennisKopljar wanted to know what could in principle be achieved with LFP vs Li metal, and now we have another code walk through, part 2!
Tl;dr - LFP/solid state/Li will could get you roughly the same as NMC811/Gr, perhaps better. Let’s go:
Modelling cell level energy density
17 Aug 2021
Thanks to those who positively responded! Happy therefore to share my cell model code here:
So far I have made 1 ‘quickstart’ example of how to build a model similar to that nested in these quote tweets, and more to come later. To quickly summarise:
On the meaninglessness of impact factor
02 Jul 2021
Given chatter about impact factor lately, I got thinking y’day about how much the average scientist should care about it at all…
Scraped my Google Scholar to see the correlation between my paper citations and the (current) JIF of the journal. There isn’t one (R² < 0.03)
The recent controversy over lithium metal calendar life
27 Mar 2021
Felt that my comments on the not-really-a-controversy on lithium metal calendar life, that @stevelevine covered in his recent article, could do with some expanding on. Nuance gets lost in tweets, that’s what threads are for, so here we go…
Battery Checklists
20 Jan 2021
This is a good checklist for anyone working with battery materials and electrochemistry, and I really encourage people to read it.
An update on QuantumScape's cycle life
08 Jan 2021
An appreciated update from QuantumScape on encouraging cycle life tests, although there is not much new info since the showcase. But I am reminded a little bit about Jeff Dahn’s “million mile battery” from ~15 months back…
2020
Pathways for QuantumScape to improve energy density
17 Dec 2020
One more(!) short thread on QuantumScape on energy density, since some were interested: based on new info last week, w/ direct scale up of where QS seems to be now gets ~300 Wh/kg, with getting to 400 Wh/kg dependent on increasing mAh/cm² and thinning the separator.
Comments on the performance of Solid Power's 20 Ah cell
15 Dec 2020
I’m a bit late to this now, but amongst last week’s flurry of solid state battery news was Solid Power announcing a new cell and releasing some cycling data, and of course there were a lot of comparisons to be drawn with QuantumScape. So let’s dig in…
Some of my thoughts already made it into this new article from Steve LeVine, which is well worth a read, but I want to go more into my reasoning…
QuantumScape's catholyte concept
13 Dec 2020
Wanted to delve into some additional thoughts on the “catholyte” aspect of QuantumScape’s battery tech which has been vigorously discussed in recent days - is it truly solid state, is their data appropriate, what about safety, etc. My take as follows:
First a recap of what the catholyte is - the word means an electrolyte confined to the cathode (positive) side of the cell, and implies a liquid component.
Live-tweeting the QuantumScape reveal
08 Dec 2020
Settling down for the much-anticipated QuantumScape reveal. A little taste of this already on their website. Feels like a thread coming on…
Live-tweeting the Tesla Battery Day
22 Sep 2020
Let’s see if Tesla Battery Day lives up to the high expectations. Assuming I stay awake I’ll add some of my takeaways in a thread here…
Estimating possible QuantumScape energy density
05 Sep 2020
Some additional thoughts and numbers on QuantumScape. Long story short: my estimate is that an “anode-free” solid state cell should fetch ~350 Wh/kg, in the absence of some new miracle positive electrode. Bit lower than 380-480 Wh/kg QS have stated.
My starting point for my (medium crude) calculations is Tesla - they have probably the most energy-dense +ve on the market now: NCA w/ 90% Ni and a high capacity of ~4.5 mAh/cm2. My cell model gets pretty close to the Model 3 2170 cell numbers, so it’s an ok starting point.
The Braga/Goodenough glass battery, part III: please, don't just take their word for it
13 Mar 2020
Introduction
If you have found your way here, you are probably already aware of the research into so-called “glass batteries” led by Maria Helena Braga and recent Nobel laureate John Goodenough.
A glass battery dataset
09 Jan 2020
For those still interested in the Braga/Goodenough “glass battery” story - the authors recently openly released cycling data (!) for the cells of apparently increasing capacity as seen in their JACS 2018 paper. Does this clear up any mysteries? Well, let’s see…
The dataset is described here and available here. I will give the authors credit for releasing cycling data at all, because most do not do this.
2019
Electrolyte rate limitations
27 Nov 2019
A paper which I would recommend reading. But it slightly annoys me, even though I agree with it. One might get the impression electrolyte limitations in battery electrodes have not been well studied, but we have known this for a long time - it just gets ignored.
While I was a 1st year PhD student, an MIT paper on an LFP coating was widely publicised on the basis that it would enable batteries that could charge in seconds, and it caused quite the controversy in the field.
My supervisor, John Owen, saw that this was misleading because of the remaining limitation from the electrolyte in the thick electrodes which are needed for practical batteries, and later published this paper, partly in response.
My experience over the years tells me that many materials scientists assume the limitation is always in the solid phase because of lower diffusion coefficients. Which is true, but electrolytes have longer diffusion lengths, much lower concentration, and mobile anions.
There’s actually a lot of work out there acknowledging this limitation and trying to overcome it. I have mentioned some of this before on Twitter, last year.
Part of the ignorance lies, I think, in choice of data presentation. In that same presentation, I had this slide. Look at the bottom right: capacity vs current density curves overlap almost perfectly for a large range in electrode thicknesses.
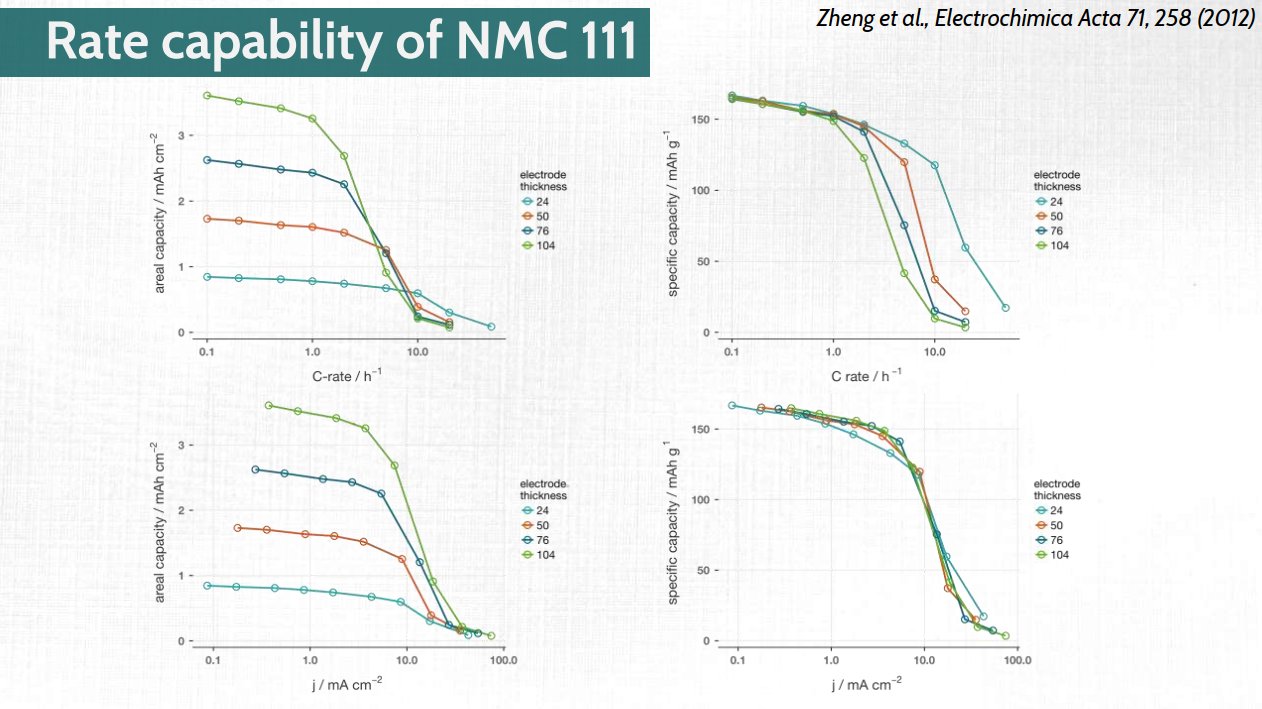
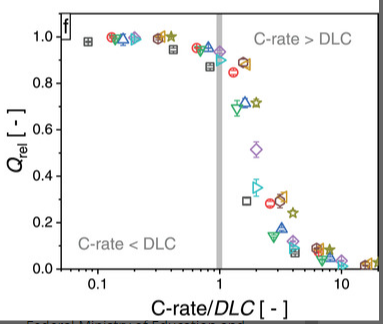
In Heubner et al (the first paper I linked) they introduce the concept of “diffusion-limited C-rate (DLC)”, which is areal current density divided by areal capacity. Notice the similarity?
Interestingly, if you look at battery papers which were published in, say, the 1980s, rate capability plots which have mA/cm2 are rather common. From a 1985 review by K.M. Abraham:
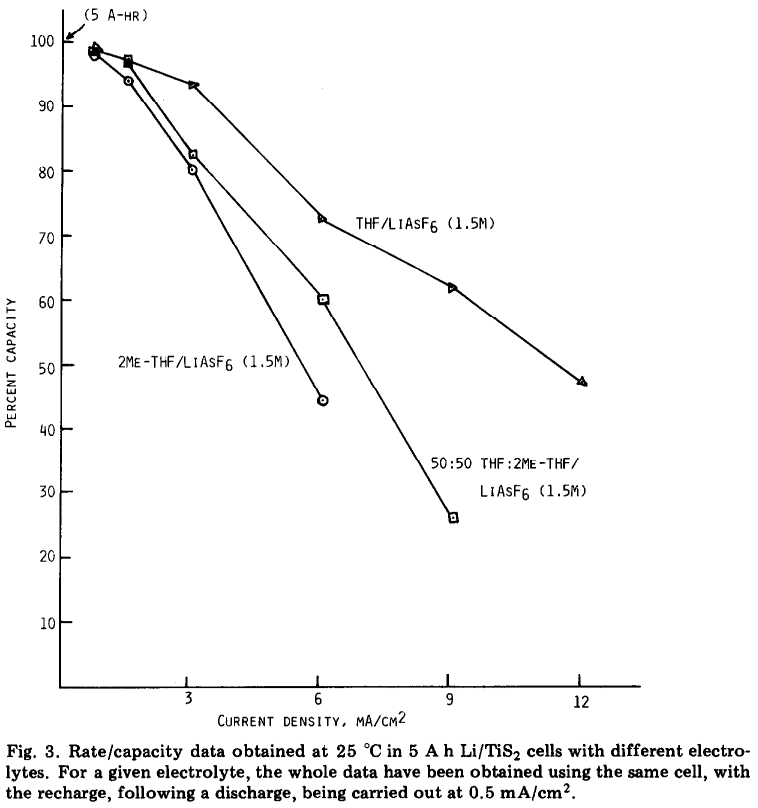
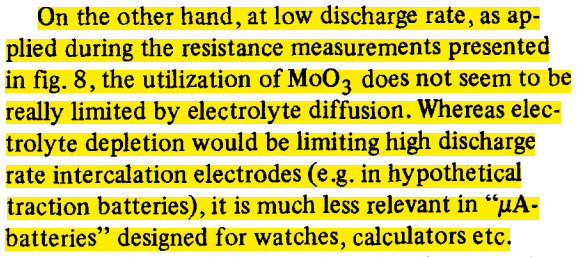
Electrolyte limitations were at least acknowledged to likely be limiting for high rates in real cases as well - did not take me long at all to find this example from 1983:
My hunch (and it’s just a hunch) is that the convenience of modern software for producing plots such as the classic “rate capability” plot (below) and an unhealthy obsession with “C-rate” have blinded a generation of researchers to important knowledge we already had.
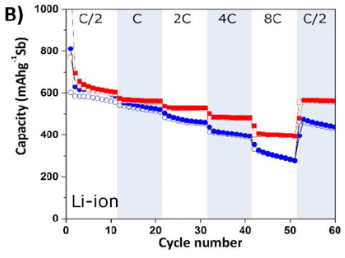
I understand the pressure to show better and better performance from new materials in published work, but what how “impactful” is it if you can make an electrode that discharges at 100 C if it only does so for 0.1 mAh/cm2 electrodes?
I’ve long urged (students especially) to give careful thought about how performance should be understood in the lab context but also on how data should be presented. If you do things just because others do it that way, what happens when the “wrong” way becomes the standard?

A million mile battery!
12 Sep 2019
I’m slow to comment on this, but this paper is well worth the read with some hugely impressive results! It is still a challenge to keep improving energy density and reaching this sort of lifetime, but it’s a strong demonstration of what is possible…
2018
My week @realscientists
26 Nov 2018
From 18 - 24 November 2018 I had the opportunity to curate the @realscientists Twitter account, and talk about batteries and our research at Uppsala University to that account’s almost 70,000 followers.
It was quite a week - intensely busy, but fun to do, and the response from those who followed my tweets was great to see.
I’ve preserved my activity for posterity in the links to all of my major talking points (as threads) in the links below.
The battery materials field needs to take open data seriously
16 Nov 2018
Two years ago I discovered an attempt at fabrication and misrepresentation of data in a manuscript which had been given to me to read ahead of its planned submission. (I want to make clear at the outset that no staff or student of Uppsala University had any role in perpetrating this fraud.)
One of the corresponding authors of the manuscript asked me to read and give my opinion on it, since I had more experience on the specific topic (related to materials for a rechargeable battery). From what I knew about the work previously I suspected the electrochemical measurement (battery test) data as being a little “too good”, even though it looked plausible. I had access to the raw data, so I analysed it myself. My instincts were correct, but I was staggered by just how “too good” the results were. The electrodes being made were not even close to the specification claimed in the experimental section, with capacities actually an order of magnitude lower than claimed. Data points were moved or removed to reduce the appearance of capacity fade. Data points were even added to make the tests look like they had run more cycles than they actually had. And there was no reproducibility in the experiments – the few tests presented were more or less the only ones that even worked.
The Braga/Goodenough glass battery part 2: of course I'm still skeptical
05 Jul 2018
The most recent post published on this topic is Part III, published on March 13th, 2020. You can find that post here.
Read my previous post on the Energy Environ. Sci. (2017) paper here. I’m sorry, this one’s really long too (~5,000 words).
2017
On the skepticism surrounding the "Goodenough battery"
29 Mar 2017
The most recent post published on this topic is Part III, published on March 13th, 2020. You can find that post here.
Last month’s announcement of a safe, cheap, fast-charging, all-solid-state and long-lived battery technology from John Goodenough’s lab was received with much fanfare by the science and technology media. The huge interest in this technology is in no small part due to the reputation of Goodenough, perhaps the most high profile scientist in the Li-ion battery field for his role in the discoveries of both lithium cobalt oxide and lithium iron phosphate, two of the most important electrode materials in Li-ion batteries. Goodenough was widely tipped for the Nobel Prize in Chemistry last year for these findings, and is still active in the field at 94 years of age. It is naturally intriguing that one of the giants of the field — and at his age — might have “done it again” and at last invented the super-battery at a time when the spotlight is on energy storage like never before.
2016
A half-solution for two (or more) y-axes with ggplot
21 Sep 2016
I’ve been teaching R, and especially ggplot, to beginners in the language this week, and predictably the topic of how to put two separate y-axes (with a common x-axis) on the same plot came up.
Unfortunately, the answer is “not easily”, since the inability to do this is on purpose (Hadley Wickham gives the reasons here, for example). Actually putting one y-axis on the left side of the graph and a different y-axis can be done, but requires some delving into the heart of ggplot which is a beyond my understanding at the moment.
Energy density and Li-S batteries
10 May 2016
Yesterday I created a new Shiny app for estimating the gravimetric energy density of Li-S cells based on ten different parameters of the materials that make up those cells.
Why we don't have battery breakthroughs
13 Mar 2016
An interesting article about the continuous battery breakthroughs which fail to materialise.
2015
Faster for loops in R
21 Dec 2015
The more I use R for data analysis at work, the more I think of how I can use it for new battery testing experiments I simply wouldn’t have been able to do before, and the more I think of how I can push it further to get more and more information. One such experiment is what I’ve been calling “resistance mapping”, which I published a couple of months ago and have written about with the help of an interactive data set here.
Exponential notation for tick labels in ggplot2
24 Nov 2015
I figured this was worth noting in a post, since it took me some time to hunt down exactly what I was looking for via Google.
My problem arose when plotting spectra with log scale axes in R using ggplot2 with the scales package, i.e., with:
scale_x_log10()R packages requiring compilation on low memory VPS
22 Jun 2015
I figured this was worth a post for the archives anyway since I didn’t find a direct solution to it via Google but eventually managed to cobble together something from various sources. Anyway, I have installed R on a VPS running Ubuntu 14.04 (as an experiment right now), but when attempting to install the dplyr package in particular by the usual method, e.g.,
The new Macbook is almost all battery inside
10 Mar 2015
Via Vox. I can’t say it’s such a surprise that this is the case but nonetheless the photo from the article, from Apple’s own presentation, is quite a striking demonstration of just how much the microelectronics field has advanced and how sluggish the improvements to energy storage have been by comparison.
Adventures in R, Episode 1
07 Mar 2015
A couple of weeks ago I started to actually learn the programming language R after a number of early little experiments, drawn to it by its power in data analysis, in visualisation (especially!) and its cost (nothing). I’ve always been crap with programming languages, I haven’t the patience to learn them and I never know what to do with them (I’m not counting markup languages like CSS and LaTeX).
2014
Setting the bar high for Li-S batteries
05 Nov 2014
Really high actually, if the performance is true.
OXIS Energy are a small company based in Oxfordshire specialising in the lithium-sulfur battery system – which naturally I’m very interested in, since this is the field I’ve worked in for the last two years. They are also probably one of the leading industrial developers of the Li-S system, along with Sion Power in the US. However, in the six years or so that I’ve been aware of their existence, the improvement in the technology hasn’t quite followed the bold predictions. For a long time it seemed that OXIS could not push much past an energy density of 200 Wh/kg – more or less equivalent to the current lithium-ion technology. Sion Power, on the other hand, have for some time been able to boast of cells with an energy density of 350 Wh/kg, but with a relatively short cycle life.
Alevo
29 Oct 2014
A couple of days ago a previously quiet group called “Alevo” broke cover and announced that they have $1bn from anonymous Swiss investors which will go into turning an old cigarette factory into a battery manufacturing plant to rival Tesla’s Gigafactory for scale.
Youtube inspiring a battery research question
28 Oct 2014
Credit goes to my colleague Julia for sharing this interesting story from the recent ECS meeting in Cancún. I didn’t know about it before, but it turns out that 2.7 million people have watched this video explaining how you can test the charge in an alkaline AA battery simply by gently bouncing it upright onto a hard surface:
Electric vehicle batteries charging in two minutes... or not
15 Oct 2014
I think it’s great that the gradual rise of electric vehicles (EVs), among other things, means that battery research can get good press, sometimes finding itself in the headlines for the science sections of major news websites. Though I’m always left a little disappointed when the context is inevitably warped and completely fanciful and unrealistic claims become the centrepiece of the article. I get it – you have to spin it to capture the imagination of the reader. But I do worry that continuous hype and over-the-top claims of super performance will ultimately sow distrust towards (and within) the field.