A glass battery dataset
For those still interested in the Braga/Goodenough “glass battery” story - the authors recently openly released cycling data (!) for the cells of apparently increasing capacity as seen in their JACS 2018 paper. Does this clear up any mysteries? Well, let’s see…
The dataset is described here and available here. I will give the authors credit for releasing cycling data at all, because most do not do this.
Unfortunately - while the authors describe it as “raw data”, it’s not - it is selected parts of processed data which is used to produce the plots in the associated paper. Real raw data would have been straight from the instrument and more useful, but let’s see what we can do..
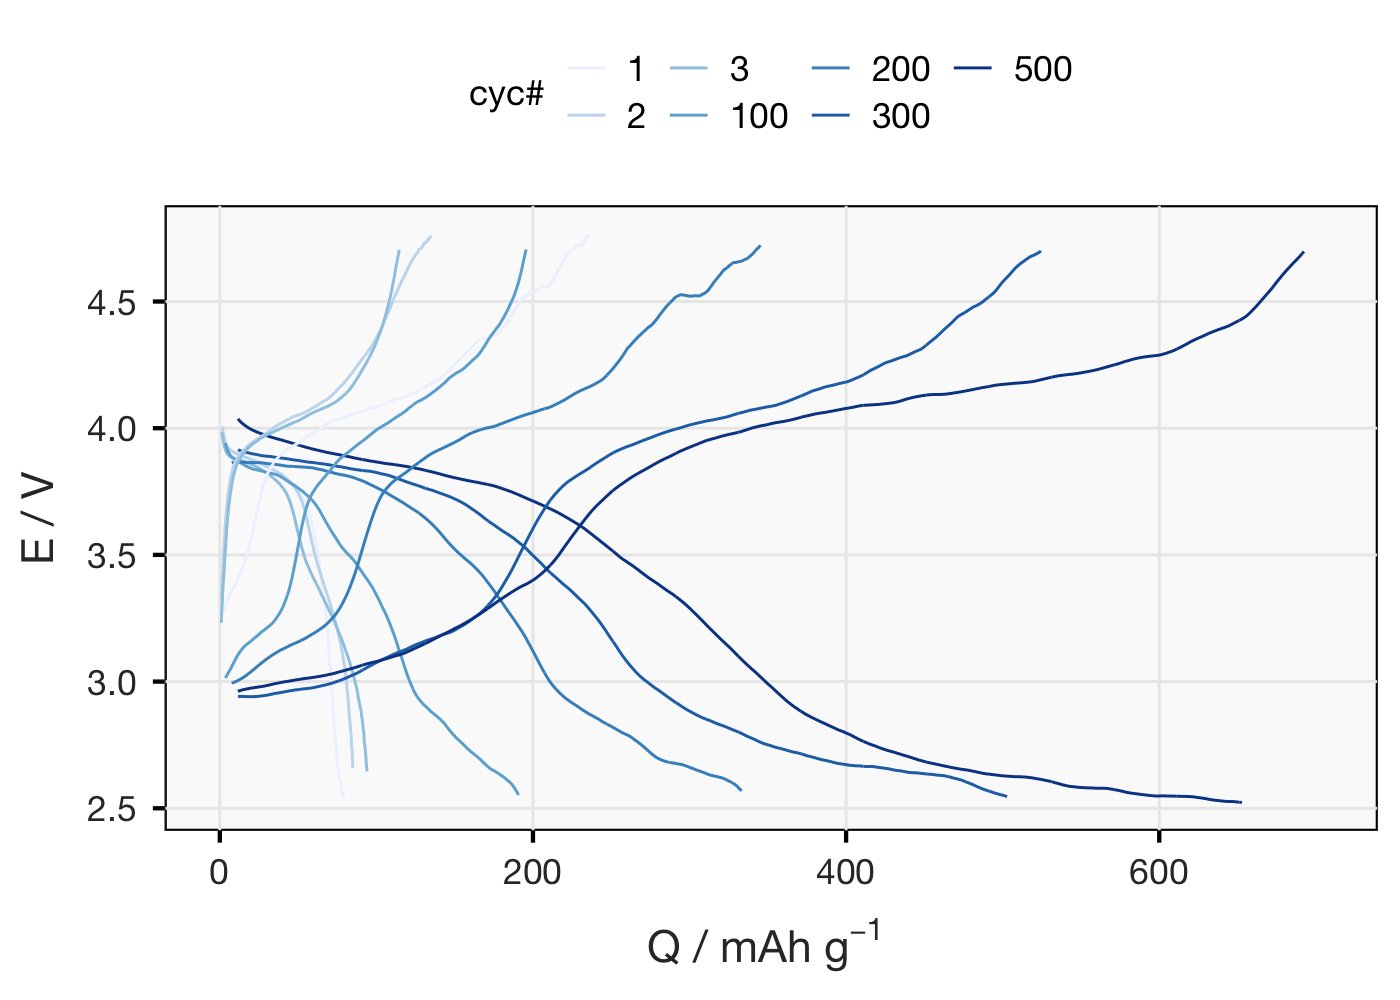
First thing I can do is replot that very congested Fig 1a (voltage profile) to see things more clearly (not best colour scale but I’m doing this rather quickly). First cycle has a big irreversible charge (33% CE), after that CE flickers around 95% and capacity goes up.
Only other thing I can really think to do with this that’s not already plotted is dQ/dV. (For non-battery nerds: in this plot, distinct redox processes show up as peaks/humps). The data is super noisy, even after going to quite some effort to smooth it out, so sorry for that..
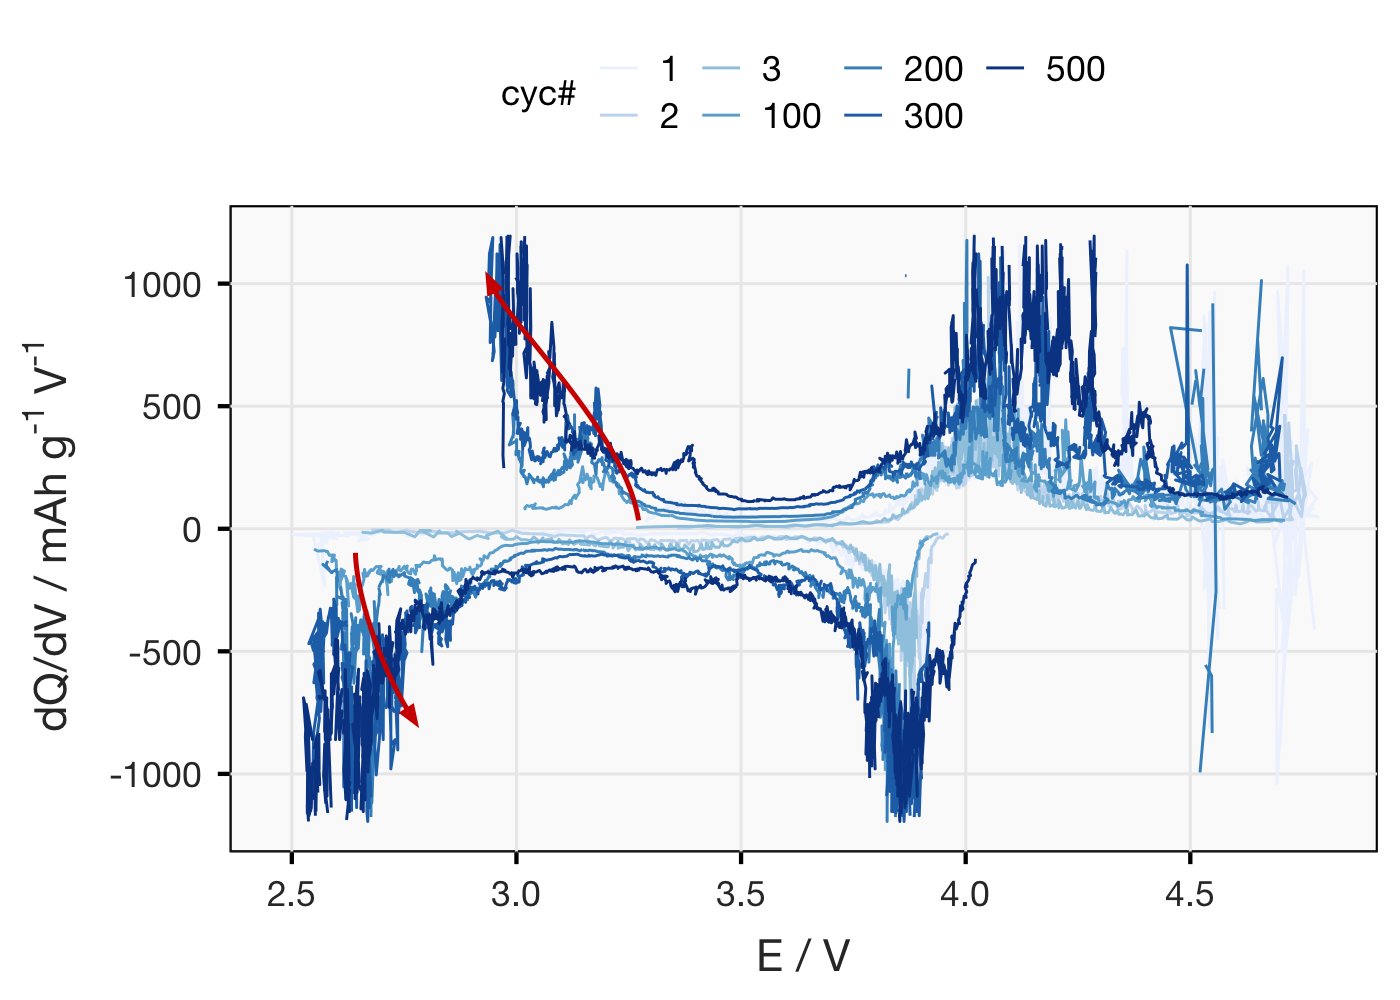
Main thing this plot makes clear is that a redox process that isn’t there in the first cycles, at ~2.8 V, gradually shows up by ~cyc 100. Redox of new stuff generated during cycling presumably? Capacity of whatever’s happening at 4 V is also going up.
Not much to be said about CE and capacity vs cyc # plots so I’ll skip to energy density. This is somewhat interesting because it provides a rather stark example of something I used to bring up in teaching…
The authors calculate ‘specific energy for the active cathode’ by multiplying average voltage (V) by specific capacity (mAh/g of cathode) = Wh/kg of active cathode. By this measure they show an increase from ~285 Wh/kg to ~2250 Wh/kg. Which seems very large…
But this number does not take into account the anode, without which the energy density is effectively zero. Or any of the other necessary dead weight components you need to make a battery! So we need to be careful in interpreting this number. Very careful…
Incidentally, I have a calculator on my website which takes all this into account… - let’s try it. I’ve taken capacity, voltage values the authors provide, as well as masses, and I’ve been generous in estimating other properties (no added liquid etc).
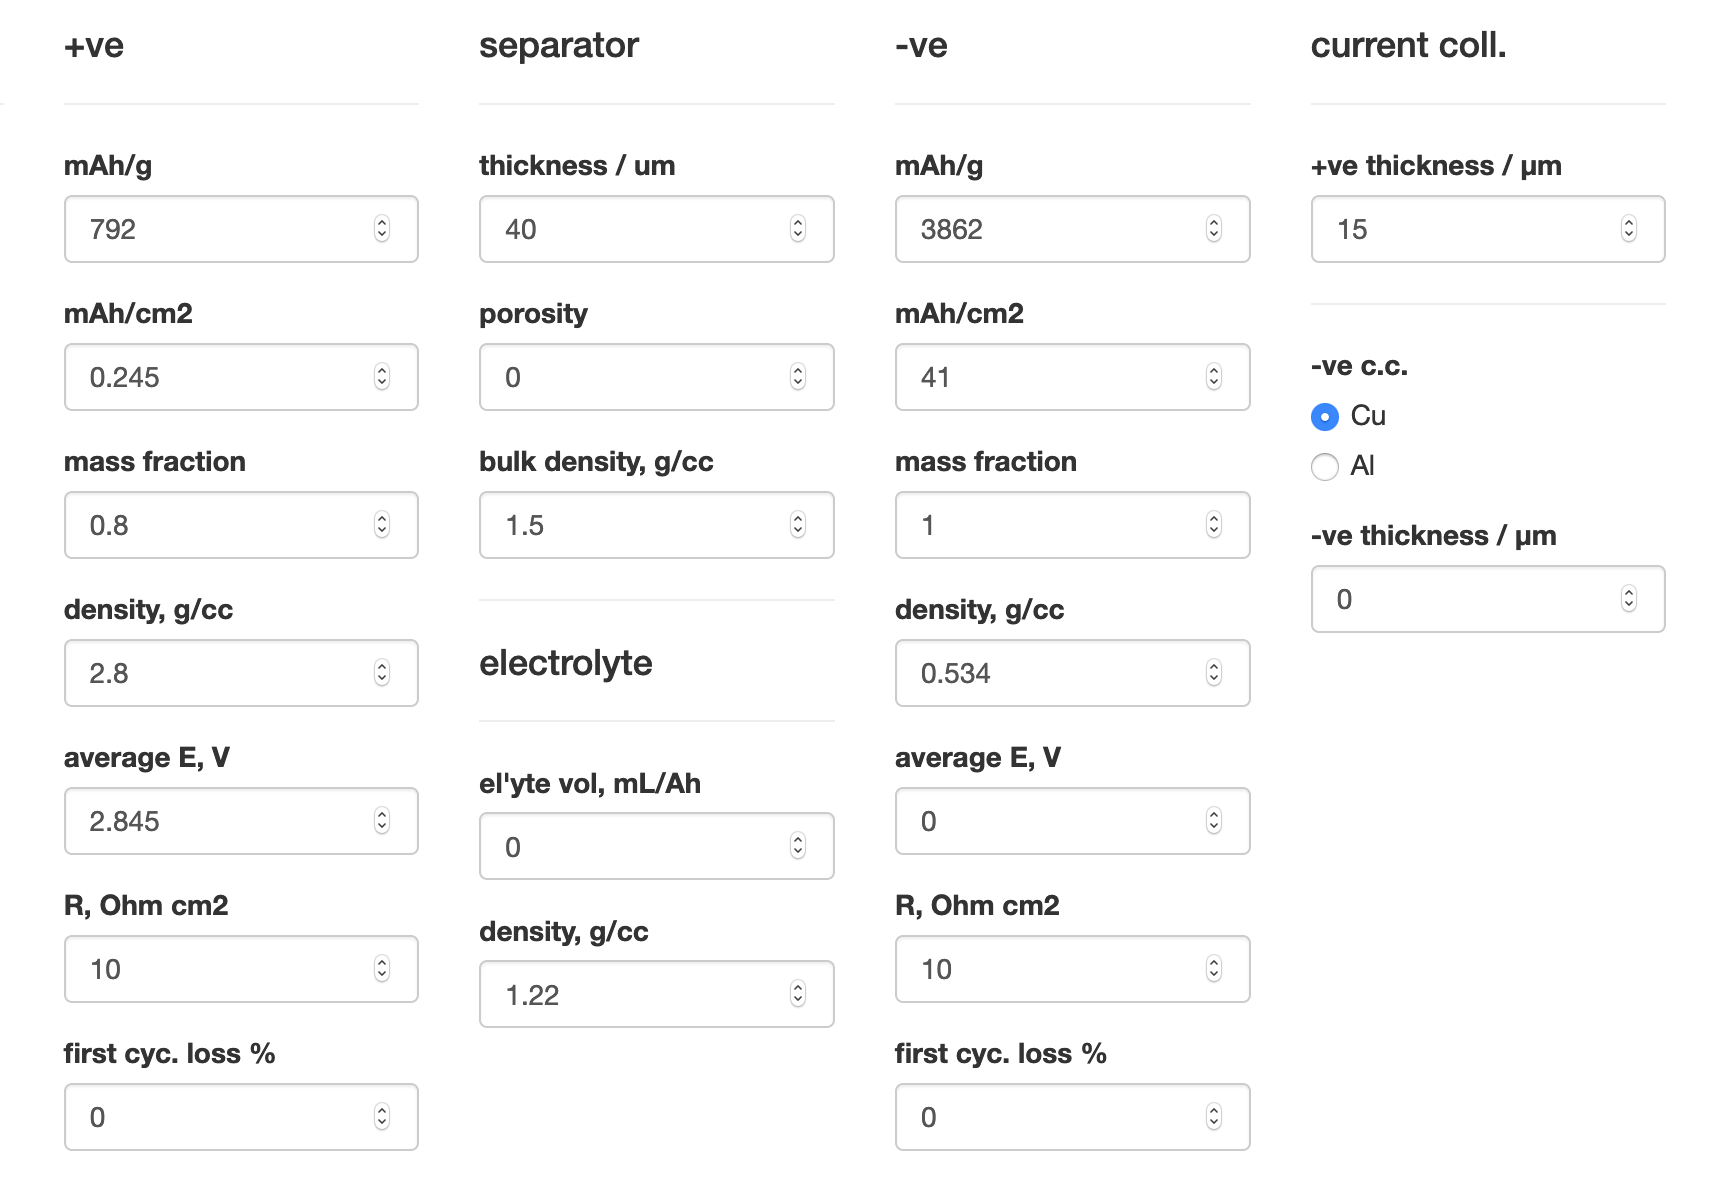
By my numbers, that 2250 Wh/kg is reduced to an estimated 24 (!!) Wh/kg by scaling what the authors used to a 2170 cell. That’s 10x less than a typical Li-ion battery. Why? Mostly, because the active material amount is very, very low (and the Li metal amount is kinda high).
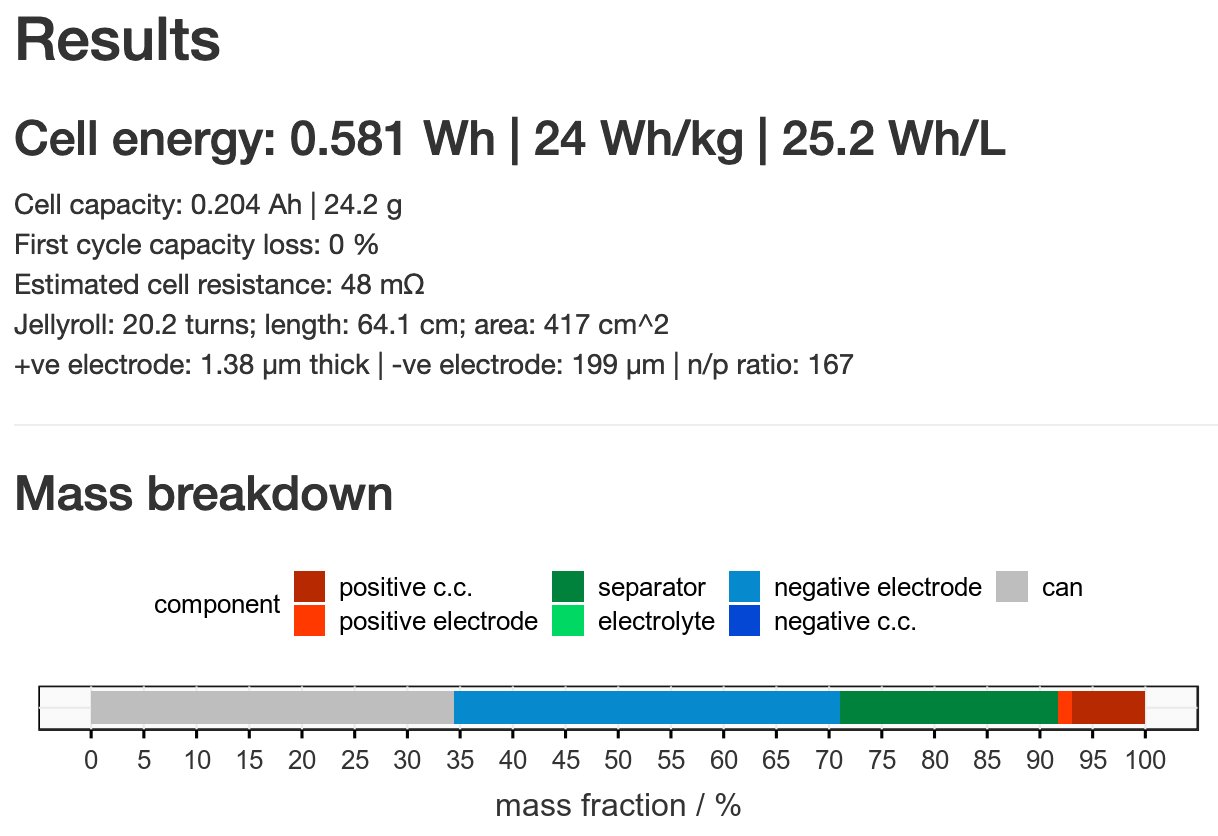
I could be more generous still and say that the anode thickness could be reduced a lot without harming energy density much but it’s still hard to come even close to helpful numbers. And this is supposed to be ~5x theoretical capacity of the material…
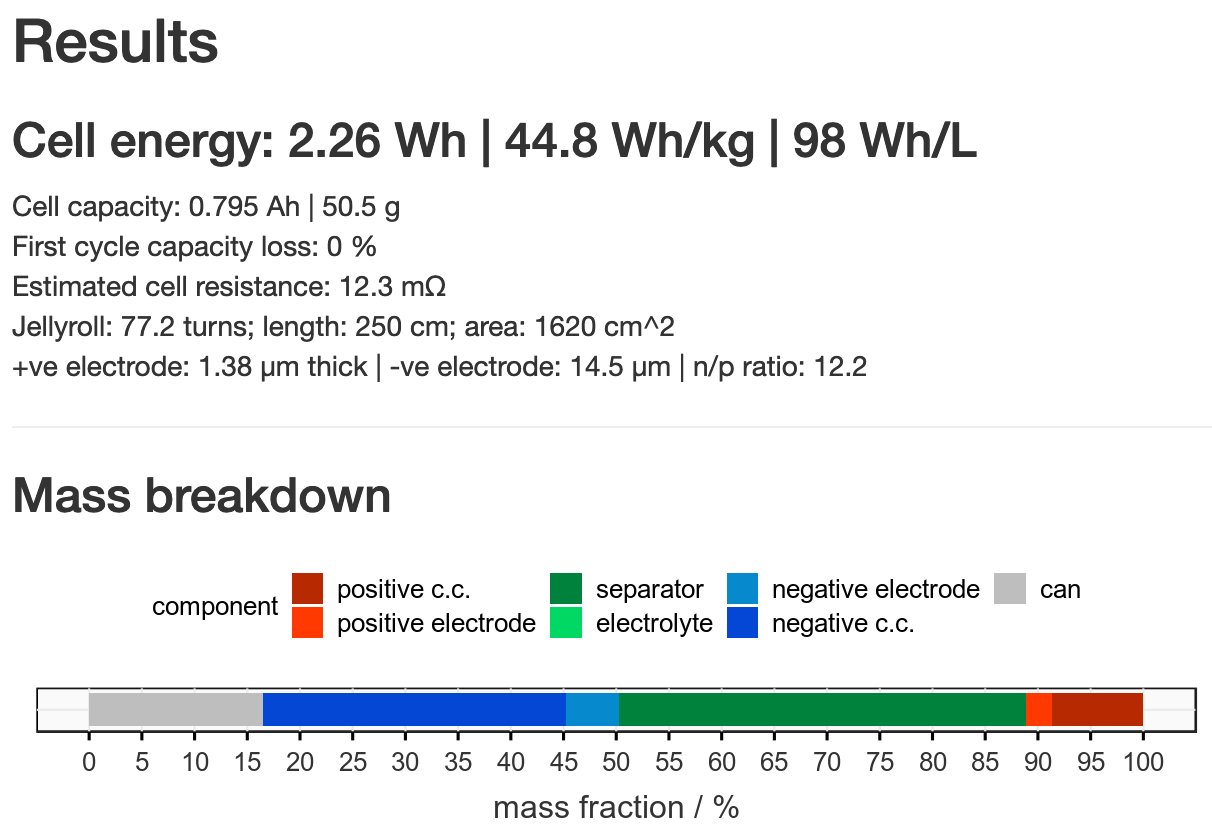
Typical active material amounts in real cells are more like 10-20 mg/cm2 of electrode - here it’s 0.35 mg/cm2. Reaching that level would make the difference. BUT! It can never be assumed you can scale up like that and that small-scale performance will stay the same.
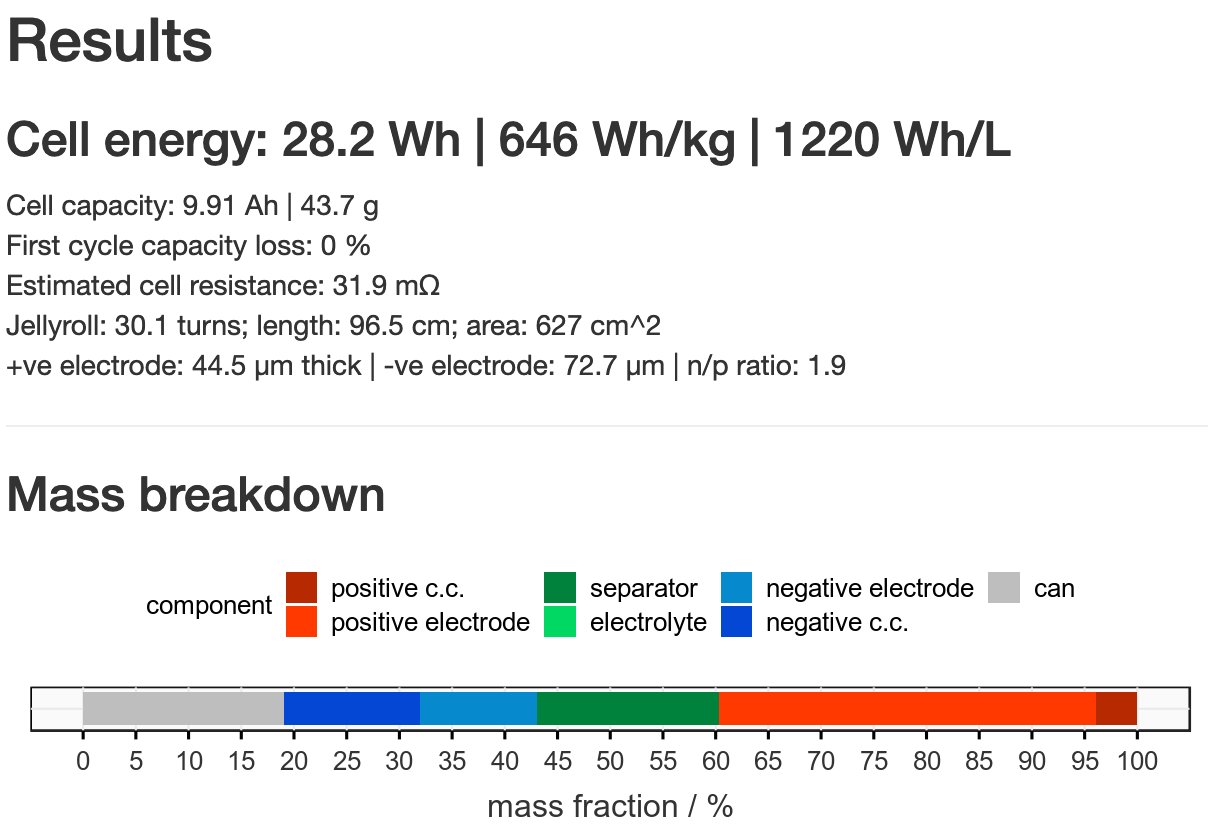
Those apparent battery breakthroughs you’ve probably heard so much about over the years, but they never seem to materialise - this is usually one of the big reasons for it. A lot of the work I did in Li-S research discussed exactly these issues.
So to conclude - I appreciate the authors releasing data, though it would have been nicer to have true raw data. They invited researchers (like me) to calculate the energy that can be stored in these devices, and I did - it’s a lot less than I assume they think it is…
But there’s plenty of lessons that can be learned here. 1. - sharing data is good. 2. Don’t just blindly linearly extrapolate small experiments to a practical device. It doesn’t work that way… /End and breathe
comments powered by Disqus