Exponential notation for tick labels in ggplot2
I figured this was worth noting in a post, since it took me some time to hunt down exactly what I was looking for via Google.
My problem arose when plotting spectra with log scale axes in R using ggplot2 with the scales package, i.e., with:
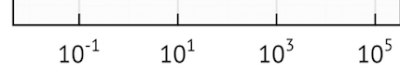
scale_x_log10()The default “scientific” notation is to present exponents in the form 1e+01, 1e+03, etc, whereas it is preferable to have 101, 103, etc. This can be accomplished by using this incantation instead:
scale_x_log10(labels=trans_format('log10',math_format(10^.x)))Much better.